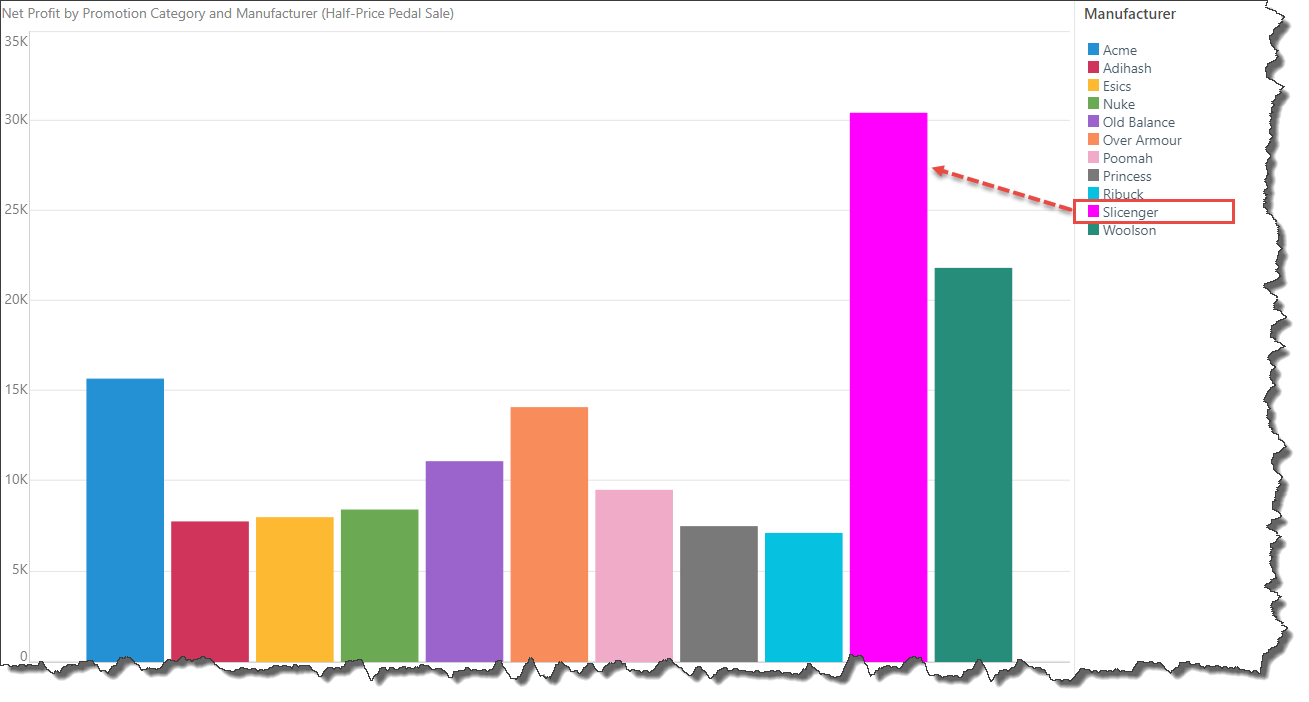
By default, all colors in the visualization, including the legend, are determined by the given report theme. The association between an item in the legend and it's corresponding data point in the visual is a called a "series". Each series can be editing, users to customize the color and font for a given legend item and the analogous data point. For instance, in the image below the Slicenger series was changed from yellow to pink.
Series editing offers the flexibility to override theme colors for the given series, without changing the theme itself.
Note: this feature is not available in the Community edition.
Discrete Legend

A discrete legend is made up of a list of elements or measures, which are color coded according to the color assigned to them in the visual. The colors and labels can be edited for specified elements from the legend itself.
To edit an element's color or labels, right click on it from the legend, and click Edit 'element name' to open the series dialog.

Shape
From the Shape tab, customize color and stroke for the given element.

Color: choose a solid color, patterned color, or gradient colors.
Stroke: add a border to the segment in the chart by assigning a width and color.
For more information about customizing series colors, click here.
Data Labels
Switch to the Data Labels tab to edit the element's data labels.
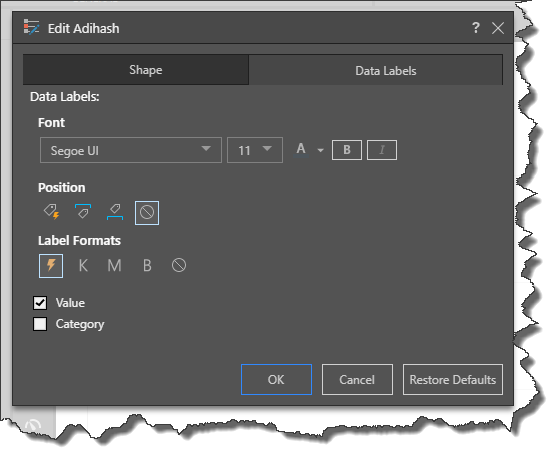
Font: edit the font for the data label of the given element
Position: change the position of the data label
Label Formats: change the format of the data label. You can choose automatic formatting, thousands, millions, billions, or the format of the measure in the data source.
Value: show the value for the data point.
Category: show the element caption.
Continuous Legend

A continuous legend displays a continuous line, or box, with a color gradient reflecting the range of values. This is the type of legend you'll see when adding a measure to the Color drop zone
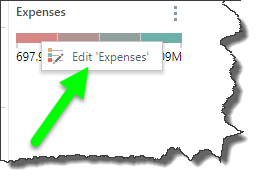
To edit a continuous legend, right click on it and select Edit 'measure name'.
From the Edit dialog, you can change the font, the measure formats, and the colors.

Font: change the font for the legend's measure labels
Format String: change the format string for the legend's measure labels
Colors: change the colors of the legend by selecting the From and To colors
Restore Defaults
To revert to the original formatting, click Restore Defaults from the series dialog.